Creating a solid application monitoring and observability strategy is a critical foundational step when deploying infrastructure or software in any environment. Monitoring ensures that your systems are running smoothly, while observability provides insights into the internal state of your application through the data generated. Together, they help you detect and address issues proactively rather than reacting after a failure occurs.
In Kubernetes environments, the complexity of managing distributed microservices can be challenging. For instance, an application usually spans multiple pods, nodes, and clusters. Because of Kubernetes’s dynamic nature, where pods are frequently created and terminated, proper monitoring and observability are ideal for capturing its fleeting behavior.
Imagine building a microservices application with several connected services handling critical components such as authentication, payments, and databases without proper monitoring. A sudden traffic spike could affect a single service, cascading to other services, causing the system to crash and resulting in downtime.
Without proper visibility, you may struggle to find the root cause of the issue. You may spend hours manually going through logs – and meanwhile, users are frustrated, and businesses are losing revenue and customer trust.
Before we begin the project, you’ll learn key monitoring and observability concepts, as well as why tools like Prometheus and Grafana are crucial for setting up a robust monitoring stack on your Kubernetes infrastructure.
Here’s what we’ll cover:
Understanding Monitoring and Observability
Implementing a proper monitoring and observability approach is important in fast-paced production Kubernetes environments. This helps in situations where downtime can lead to serious business loss and damage to customer trust. It’ll hopefully help you avoid the dreaded 2 am calls that are usually triggered by alert noise so you can focus on adding more innovative features to your software (rather than spending so much energy firefighting).
Monitoring and observability are often referred to as the same thing. But they serve two different purposes, especially for development and engineering teams.
Monitoring
In the software development lifecycle, monitoring is the practice of analyzing data in real time or reviewing data trends to ensure the health and performance of systems, infrastructure, and applications. Monitoring acts as the eyes and ears of your IT operations, collecting insightful data and presenting it in a way that is actionable.
If you have visited the IT department of a well-established organization, you have most likely seen large screens displaying colorful dashboards with charts and real-time statistics. This offers a centralized view of the key metrics, such as the server uptime, application response times, and resource usage.
Observability
Observability helps to address issues that haven’t been anticipated. These are usually called “unknown unknowns.” Unlike monitoring, which deals with predefined parameters and data, observability goes deeper into the application to give a broader view.
This not only helps to answer what is happening within your system and why it is happening. It also uses patterns within the system and application operations to detect and resolve issues efficiently.
Observability revolves around the three pillars of data: metrics, logs, and traces.
1. Metrics
Metrics consist of time-series measurements such as CPU usage and memory consumption. These data points help teams to manage, optimize, and predict system performance and deviations from expected behavior.
2. Logs
Logs serve as a history of what happened within the system. It is a trail for engineers, especially during troubleshooting. Logs are important in diagnosing root causes and discovering malicious activities.
3. Traces
Traces provide insights into application workflows by tracking requests as they move through various components. They are good for highlighting latency issues and potential points of failure.
Now that you understand the theory behind monitoring and observability, you may be wondering what platforms and tools are available to developers to collect data and get insights about their services.
In the world of cloud-native infrastructure and Kubernetes, many users gravitate towards the popular stack of Prometheus and Grafana.
Prometheus
Prometheus is an open-source tool that specializes in collecting metrics as time-series data. The information is stored with the timestamp when it was recorded.
The Prometheus ecosystem includes the main Prometheus server, which scrapes and stores time-series data, an alert manager for managing alerts, a push gateway for handling metrics from short-lived jobs, and exporters for collecting metrics from various services connected to the cluster.
It fits both in machine-centric and application-centric monitoring, especially for microservices in a Kubernetes cluster. It’s designed to be the system you go to if there is a system outage and you need to quickly diagnose problems.
The Prometheus ecosystem includes the main Prometheus server, which scrapes and stores time-series data, an alert manager for managing alerts, a push gateway for handling metrics from short-lived jobs, and exporters for collecting metrics from various services connected to the cluster.
Prometheus fits both in machine-centric and application-centric monitoring, especially for microservices in a Kubernetes cluster. It’s designed to be the system you go to if there is a system outage and you need to quickly diagnose problems.
Grafana
Grafana is a visualization tool that transforms, queries, visualizes, and sets alerts on raw metrics stored in Prometheus. With Grafana, you can explore metrics and logs wherever they are stored and display the data on live dashboards. This allows teams to monitor system performance, identify trends, and act quickly on anomalies.
Prometheus and Grafana are compatible with containerized applications, especially in Kubernetes environments. It can also manage workloads outside Kubernetes for flexibility. They are both open-source tools that give developers control over the implementation. There is no licensing cost, which helps teams that cannot afford expensive, powerful solutions.
By combining Prometheus and Grafana, your team gets helpful insights into the system to optimize performance, track errors, and aid troubleshooting processes.
How to Deploy Prometheus and Grafana on AWS EKS using Helm
Prerequisites
For this project, we will use an EC2 instance with the Ubuntu 22.04 operating system. If you are using Windows or a Mac, log into AWS to create your virtual machine.
Here’s what else you’ll need:
1. AWS account setup with access keys and secret keys
2. Knowledge of Kubernetes
3. AWS CLI installation for the virtual server
Getting Started
Let’s start by setting up an EKS cluster on a virtual server and installing the required tools on the server. Then, we’ll deploy our monitoring tools, Prometheus and Grafana, using Helm charts. In the end, we’ll deploy an NGINX web application on Kubernetes and use Grafana to visualize the pod performance and cluster resource usage on the cluster.
Step 1: Install AWS CLI, eksctl, kubectl, and Helm
AWS CLI is a tool that allows users to interact with AWS services using the command-line interface. It makes the management of cloud resources simpler and enables admins to configure AWS services.
Here, we will install AWS CLI on our server to be able to create Kubernetes resources.
On your server, run the following commands:
curl "https://awscli.amazonaws.com/awscli-exe-linux-x86_64.zip" -o "awscliv2.zip"

sudo apt install unzip

unzip awscliv2.zip

sudo ./aws/install
Verify the installation by running this:
aws --version
After installation, configure the AWS CLI with your credentials using the following command:
aws configure
You will be prompted to enter your AWS Access Key ID, Secret Access Key, Default region name, and default output format.
Next, we need to install eksctl. eksctl is a command-line tool that simplifies the creation and management of Kubernetes clusters on AWS. It helps you configure, set, and maintain clusters and allows you to manage clusters more effectively.
This tool removes the complexities of setting up a production-grade cluster, helping you and your admins focus only on application development and deployment.
To set up eksctl on your machine, download the latest release using the following command:
ARCH=amd64

PLATFORM=$(uname -s)_$ARCH

curl -sLO "https://github.com/eksctl-io/eksctl/releases/latest/download/eksctl_$PLATFORM.tar.gz"


curl -sL "https://github.com/eksctl-io/eksctl/releases/latest/download/eksctl_checksums.txt" | grep $PLATFORM | sha256sum --check

tar -xzf eksctl_$PLATFORM.tar.gz -C /tmp && rm eksctl_$PLATFORM.tar.gz

sudo mv /tmp/eksctl /usr/local/bin
Run eksctl version to confirm its successful installation and the version downloaded.
eksctl version
Next, we’ll run Kubectl which is a command line interface for managing and interacting with Kubernetes clusters. It enables users to deploy and manage applications within a Kubernetes environment.
With Kubectl, you can perform various crucial operations such as scaling, deployments, inspecting cluster status, and managing networking.
To install kubectl, run the following commands:
curl -LO "https://storage.googleapis.com/kubernetes-release/release/$(curl -s https://storage.googleapis.com/kubernetes-release/release/stable.txt)/bin/linux/amd64/kubectl"
chmod +x ./kubectl
sudo mv ./kubectl /usr/local/bin
Run kubectl on your command line to confirm it has been installed successfully:
kubectl version
Finally, we’ll install Helm which is a Kubernetes Package manager that simplifies the deployments and management of applications in Kubernetes. It uses charts to define Kubernetes resources into a collection of files, handles templating and versioning, and makes application deployment easier.
Here, we will install the Helm package manager on our virtual machine for our cluster deployments. This downloads the installation script and saves it in the get_helm.sh file.
Next, the file is set to executable, which allows only the user to run it. Finally, the script is executed using the ./get_helm.sh command.
curl -fsSL -o get_helm.sh https://raw.githubusercontent.com/helm/helm/master/scripts/get-helm-3

chmod 700 get_helm.sh

./get_helm.sh
Step 2: Create a Kubernetes Cluster
Next, we need to create our Kubernetes cluster in AWS with the eksctl command line. We can do this with the following command:
eksctl create cluster --name my-prac-cluster-1 --version 1.30 --region us-east-1 --nodegroup-name worker-nodes --node-type t2.medium --nodes 2 --nodes-min 2 --nodes-max 3
Let’s break down the command:
-
–name my-prac-cluster-1: This specifies the name of the EKS cluster that will be created. In this case, the cluster will be named my-prac-cluster-1. -
–version 1.30: This sets the Kubernetes version for the cluster. Here, the version will be version 1.30. -
--region us-east-1: This specifies the AWS region where the cluster will be provisioned on AWS. Here, it is set to us-east-1. -
--nodegroup-name worker-nodes: This defines the name of the node groups that will be created. In this case, it’s named worker-nodes. -
--node-type t2.large: This sets the instance type for the worker nodes in thenode-group. -
--nodes 2: This sets the desired number of worker nodes in the node group. -
--nodes-min 2: This sets the minimum number of worker nodes that should be maintained in the node group to 2. -
--nodes-max 3: This defines the maximum number of worker nodes allowed in the node group and sets it to 3.
Once the cluster comes up, run the command kubectl get nodes to ensure that the cluster is set up properly.
Step 3: Install the Metrics Server
The metrics server is a component that collects resource data from the Kubelets on each node in the cluster. This includes metrics such as CPU, memory, and network usage, which Prometheus can access. The server provides a single source of truth for resource data and is easy to deploy and use.
Run the following script to install the metrics server:
kubectl apply -f https://github.com/kubernetes-sigs/metrics-server/releases/latest/download/components.yaml
To verify the installation, run the following command:
kubectl get deployment metrics-server -n kube-system

Step 4: Install the IAM OIDC Identity Provider and Amazon EBS CSI Driver
The IAM OpenID connect provider allows Kubernetes access to AWS resources within the cluster. Here, we need EBS volumes to create persistent storage for Prometheus pods.
Run the following commands to create the IAM OIDC provider:
eksctl utils associate-iam-oidc-provider --cluster my-prac-cluster-1 --approve
Next, we will create the Amazon EBS CSI Driver that will provide permissions for the cluster to access the EBS volumes. Replace the placeholder “my-cluster” with your cluster name.
eksctl create iamserviceaccount \

--name ebs-csi-controller-sa \

--namespace kube-system \

--cluster my-prac-cluster-1 \

--role-name AmazonEKS_EBS_CSI_DriverRole \

--role-only \

--attach-policy-arn arn:aws:iam::aws:policy/service-role/AmazonEBSCSIDriverPolicy \

--approve
Now, we need to add the AWS EBS Driver Addon to the cluster using the following commands:
eksctl create addon --name aws-ebs-csi-driver --cluster <cluster_name> --service-account-role-arn arn:aws:iam::<AWS_ACCOUNT_ID>:role/AmazonEKS_EBS_CSI_DriverRole --force
Adding the AWS EBS CSI Driver to your Kubernetes cluster enables the cluster to dynamically create and manage EBS volumes for persistent storage within the cluster. Since our Prometheus installation needs persistent volumes, this add-on will enable the cluster to create EBS volumes to persist data.
Now, our future Prometheus installation will create EBS volumes for persistent storage.
Step 5: Install Prometheus and Grafana.
To install Prometheus and Grafana, we need to add the Helm Stable Charts for the local client.
Run the command below:
helm repo add stable https://charts.helm.sh/stable
Next, we will add the Prometheus Helm repo:
helm repo add prometheus-community https://prometheus-community.github.io/helm-charts
We’ll use the Prometheus community version because it is well-maintained by the Prometheus community. It offers faster updates and continuous improvements for different Kubernetes environments.
Next, create the Prometheus namespace:
kubectl create namespace prometheus
Install Prometheus and Grafana through the kube-prometheus-stack Helm Chart:
helm install stable prometheus-community/kube-prometheus-stack -n prometheus
When that’s done, verify that the Prometheus deployment and service are installed by using the command below:
kubectl get all -n prometheus
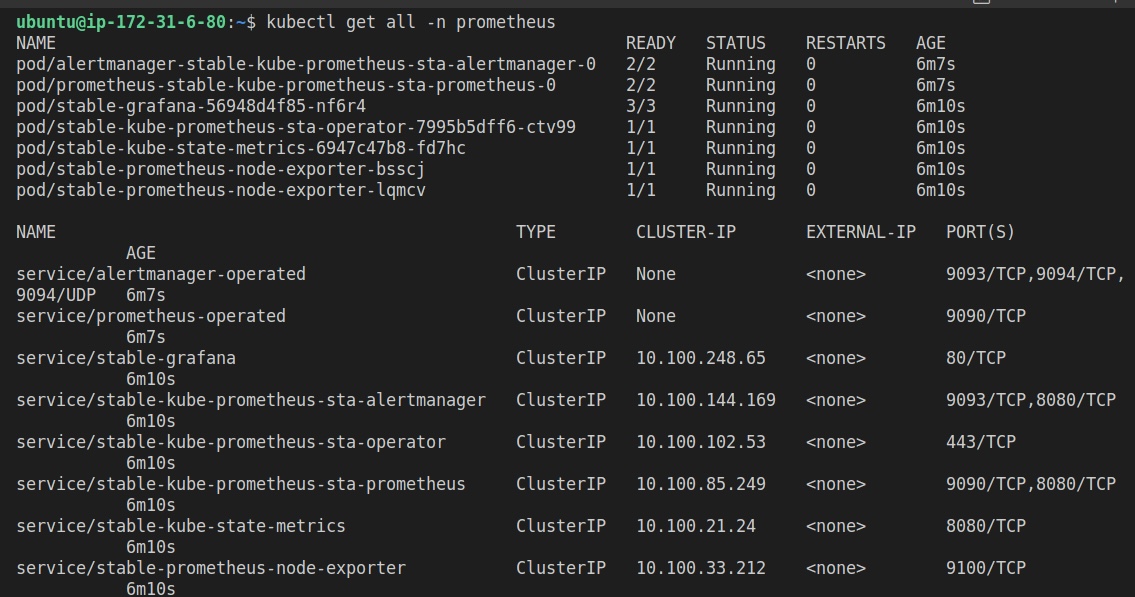
At this stage, you should change the service type from a ClusterIP to a LoadBalancer in the manifest file. We can update the file by running the command below:
kubectl edit svc stable-kube-prometheus-sta-prometheus -n prometheus
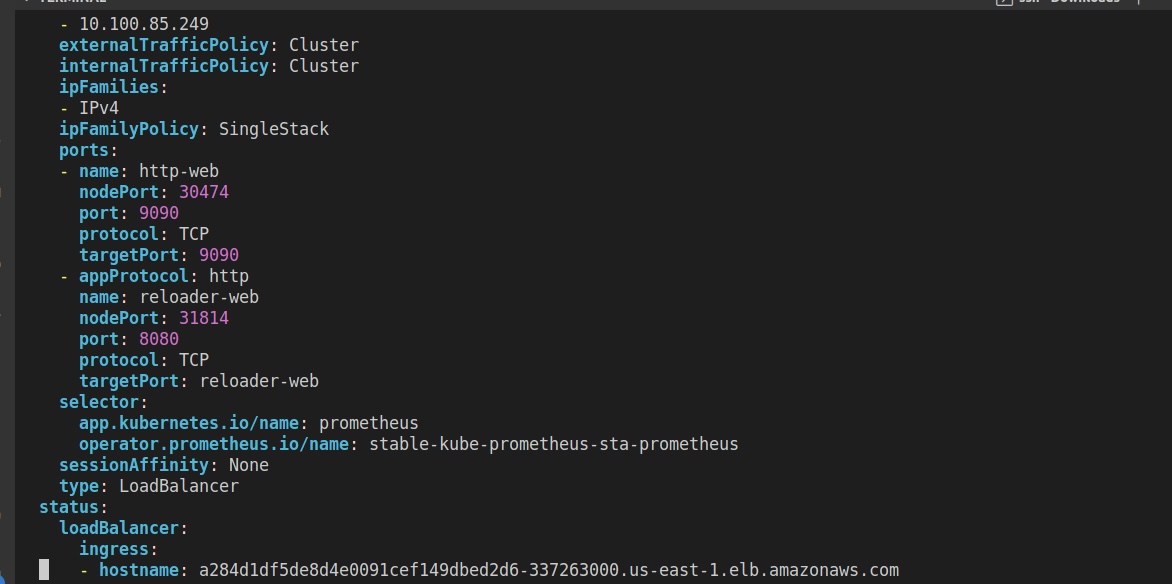
After the update, a LoadBalancer URL will be generated for you to access your Prometheus Dashboard.
Next, we’ll move over to Grafana. Change the SVC file of Grafana to create a LoadBalancer and expose it to the public using the command below:
kubectl edit svc stable-grafana -n prometheus
Next, we will update the Grafana SVC file by changing the service type from ClusterIP to LoadBalancer to expose it to the public using the command below:
kubectl edit svc stable-grafana -n prometheus
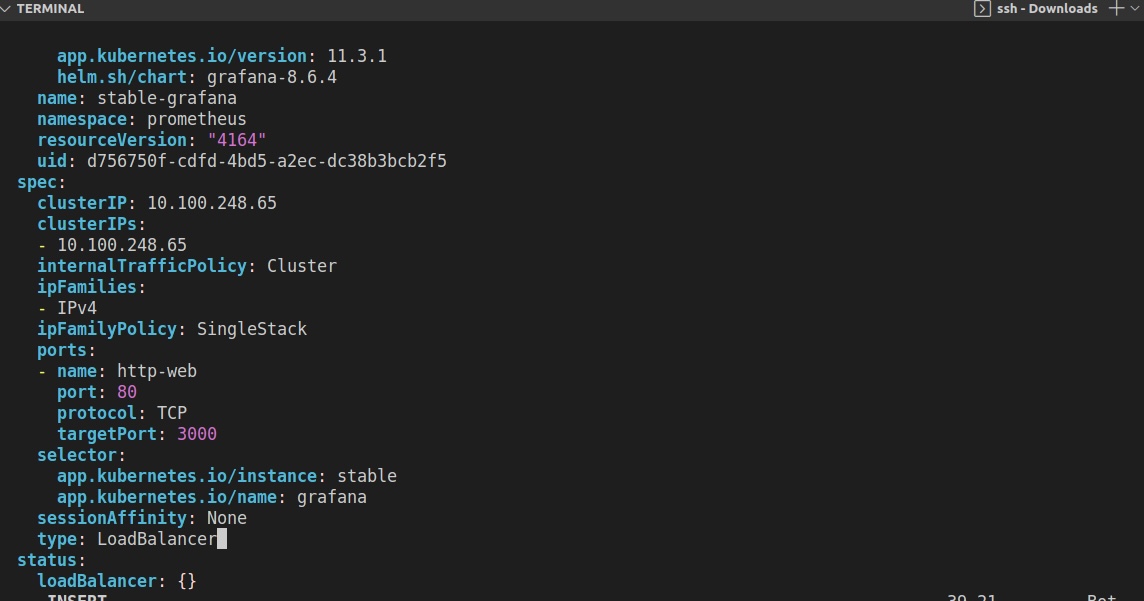
Once the settings are saved, you can use the LoadBalancer link to access your Grafana Dashboard from the browser. The username is admin. To get the login password printed in the terminal, run the following command:
kubectl get secret --namespace prometheus stable-grafana -o jsonpath=".data.admin-password" | base64 --decode ; echo
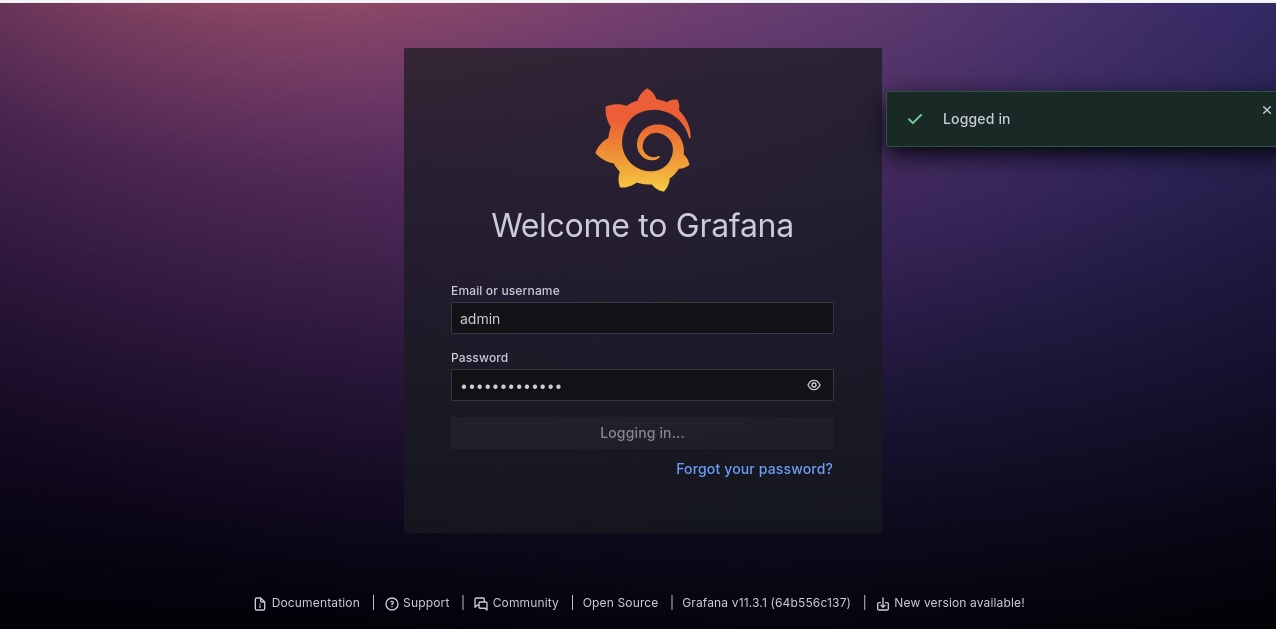
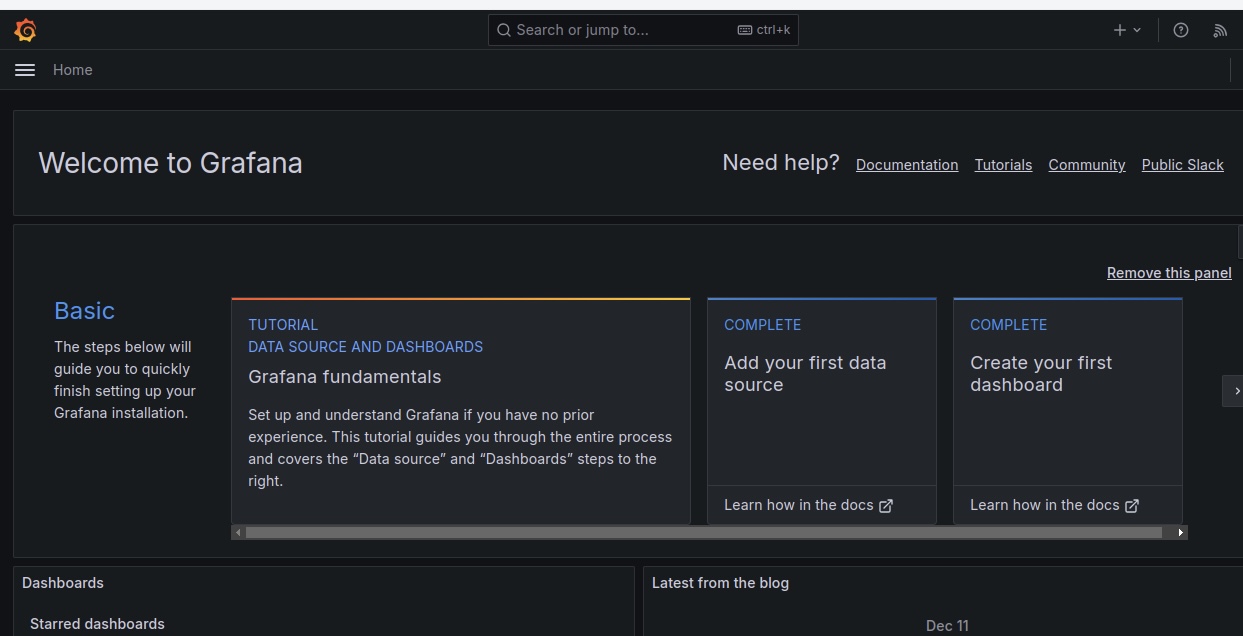
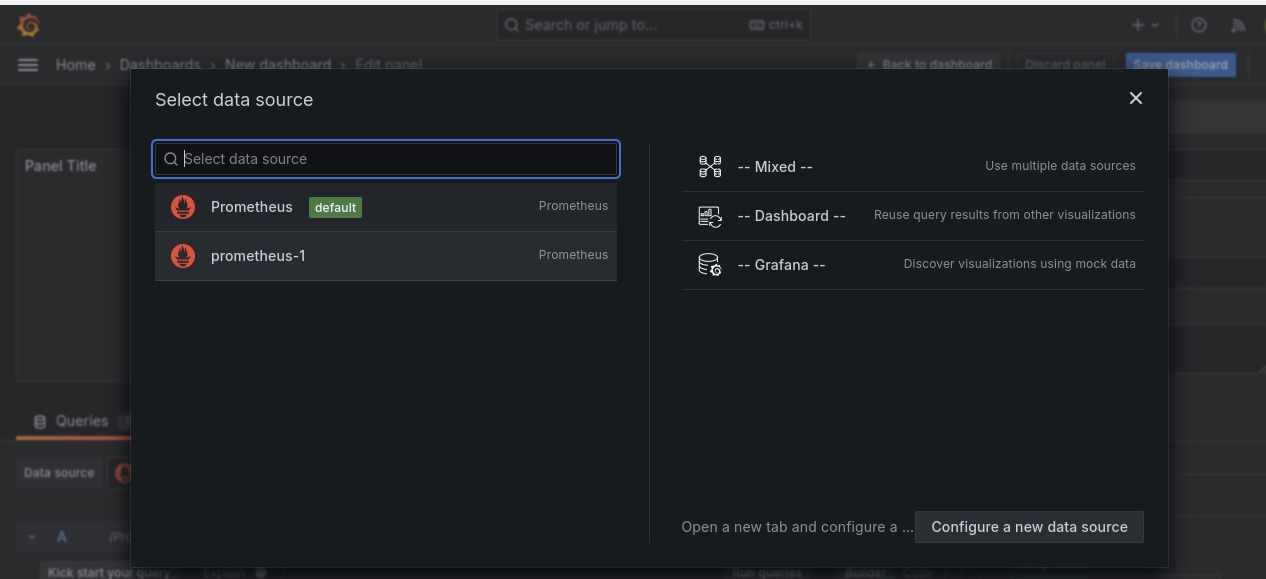
After successfully logging into the Grafana dashboard, the first step is to create a datasource that will provide the metrics for the Grafana visualization.
Go to Add your first data source and choose Prometheus as the Data Source.
Insert the Prometheus URL, and click on “Save and Test”. It should show success if Grafana queries the Prometheus URL successfully.
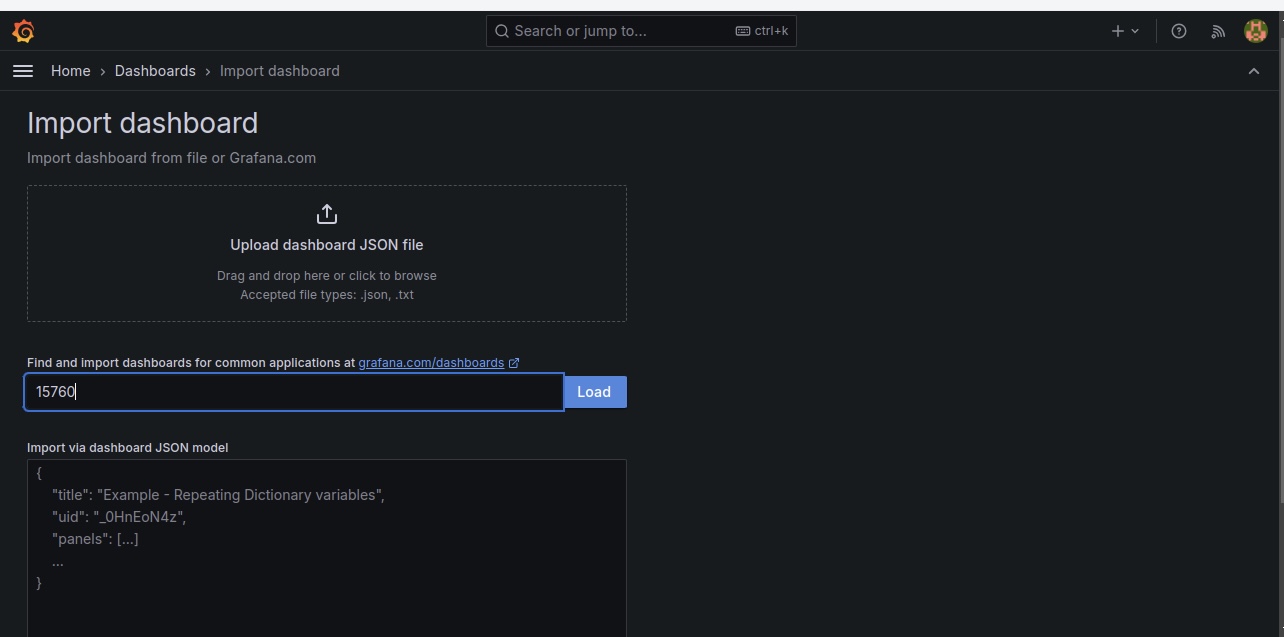
The next step is to create a Dashboard that our Grafana visualization will use to view the metrics of our pods. To do so, click on “Dashboards” and then on “Add Visualization.”
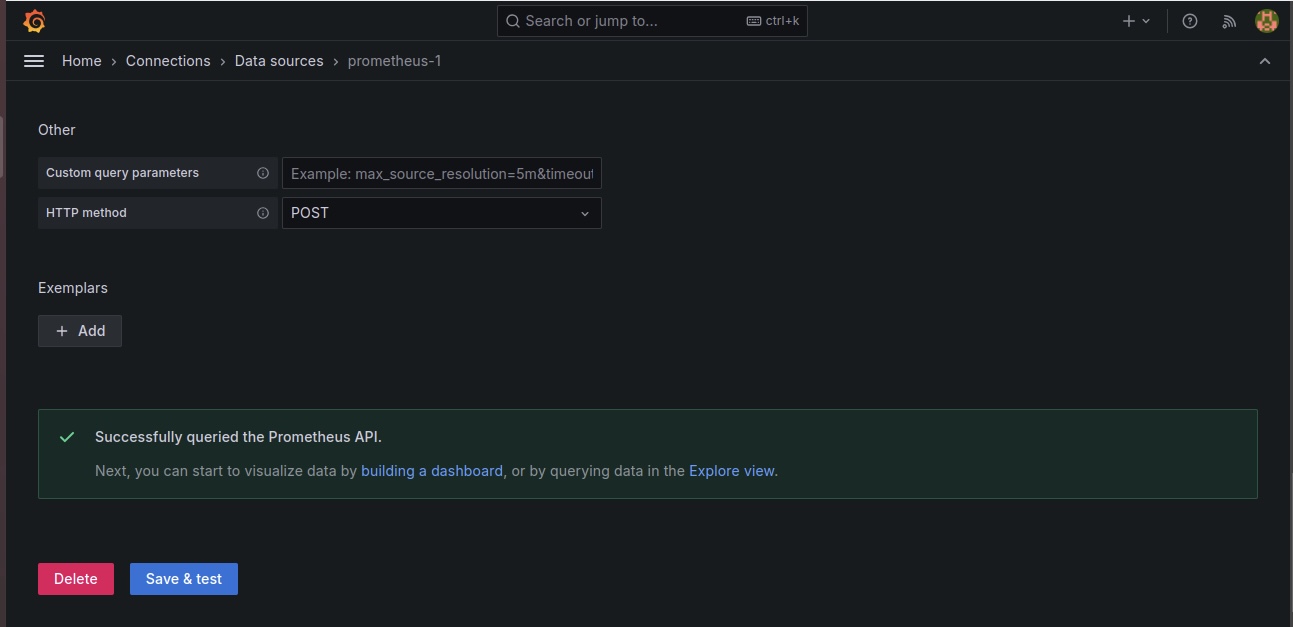
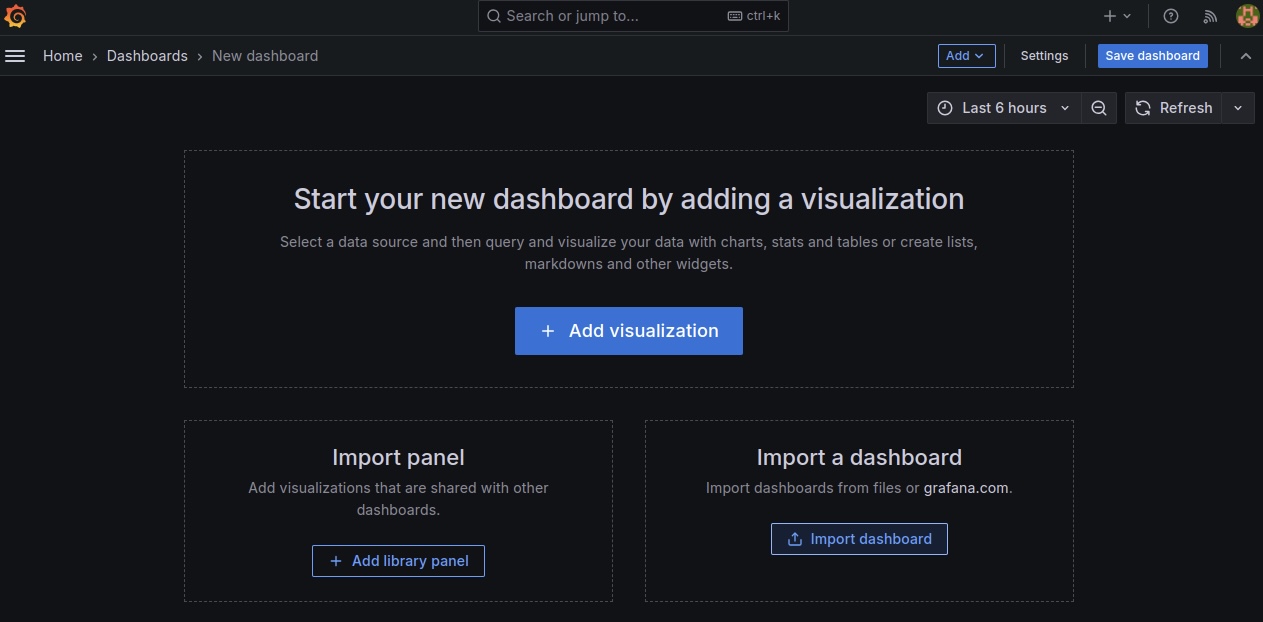
You’d be taken to an environment where you’d be required to import a dashboard. Select the data source as “Prometheus-1” and use the code “15760” to import the Node Exporter dashboard to view our pods.
Click on Load after importing the dashboard, and you will see your newly created dashboard.
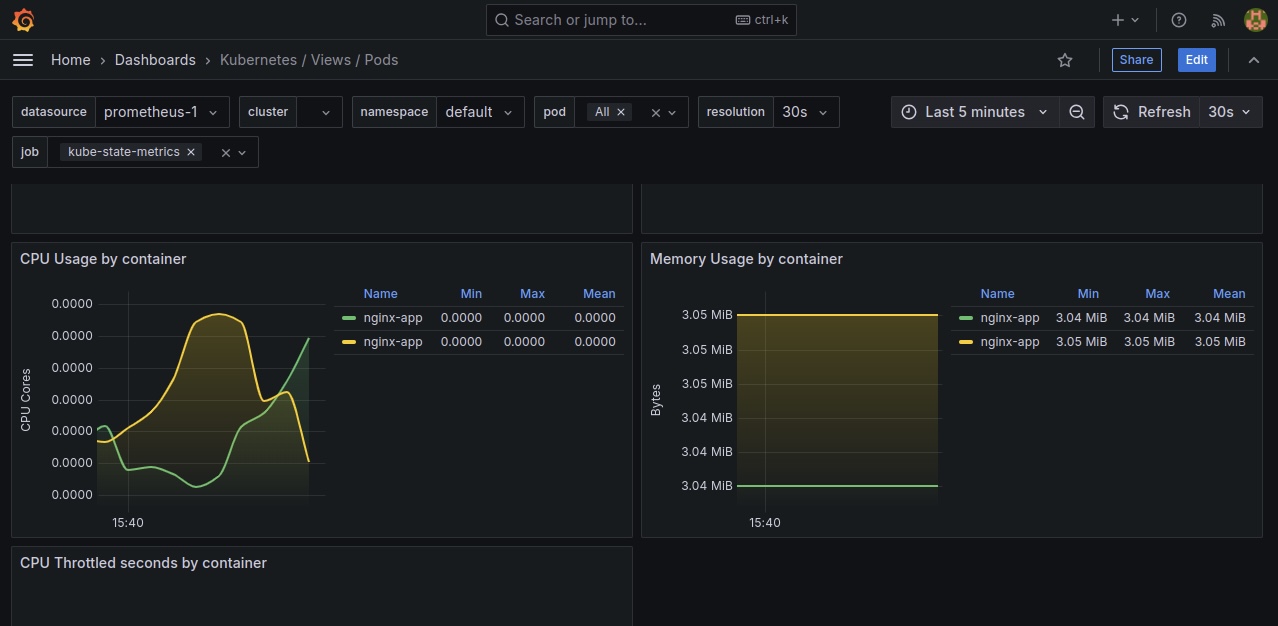
Here, we can see the entire data of the cluster, the CPU and RAM use, and data regarding pods in a specified namespace.
Step 6: Deploying an Application on Kubernetes to Monitor on Grafana.
Finally, we will deploy an NGINX container in our EKS Cluster to monitor using Grafana. We need to create a Yaml deployment and service file.
apiVersion: apps/v1

kind: Deployment

metadata:

name: nginx-app

spec:

replicas: 2

selector:

matchLabels:

app: nginx-app

template:

metadata:

labels:

app: nginx-app

spec:

containers:

- name: nginx-app

image: nginx:latest

ports:

- containerPort: 80

---

apiVersion: v1

kind: Service

metadata:

name: nginx-app

spec:

type: LoadBalancer

ports:

- port: 80

targetPort: 80

selector:

app: nginx-app
To deploy the Node.js application on the Kubernetes cluster, use the following kubectl command. Verify the deployment by running the following kubectl command:
kubectl apply -f deployment.yml

kubectl get deployment

kubectl get pods
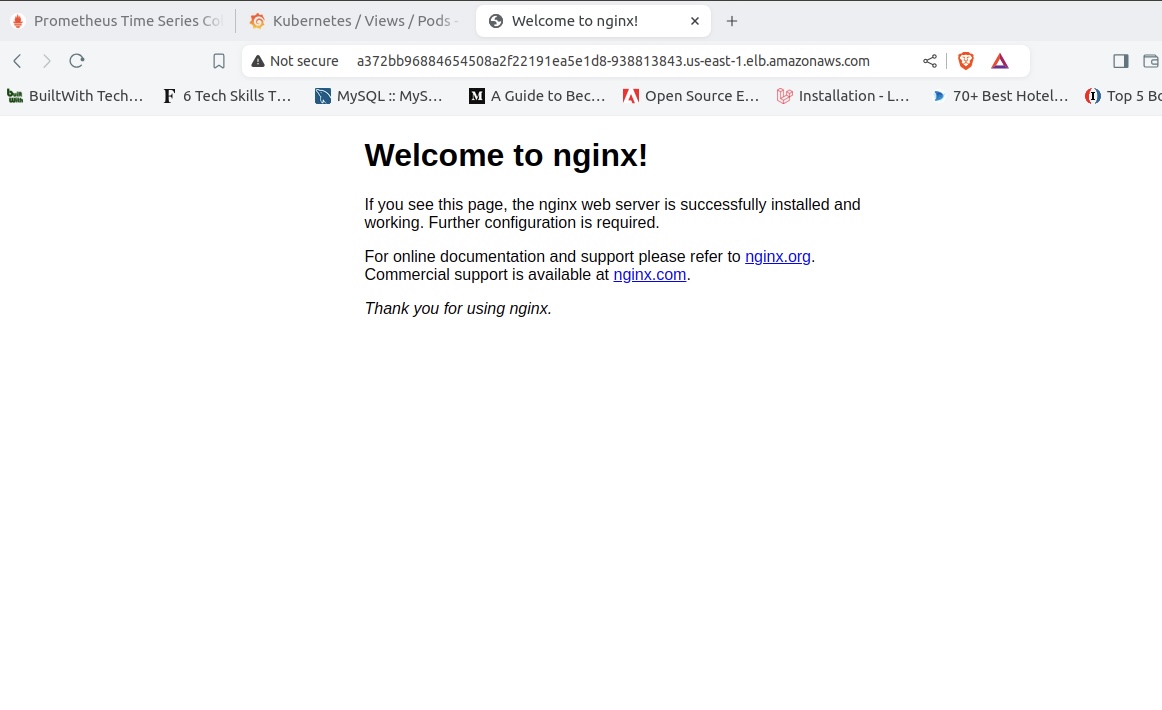
Click the load balancer URL to see your application on your browser:
Let’s refresh our Grafana dashboard to see our NGINX web application in Grafana.
Step 7: Deleting the Cluster
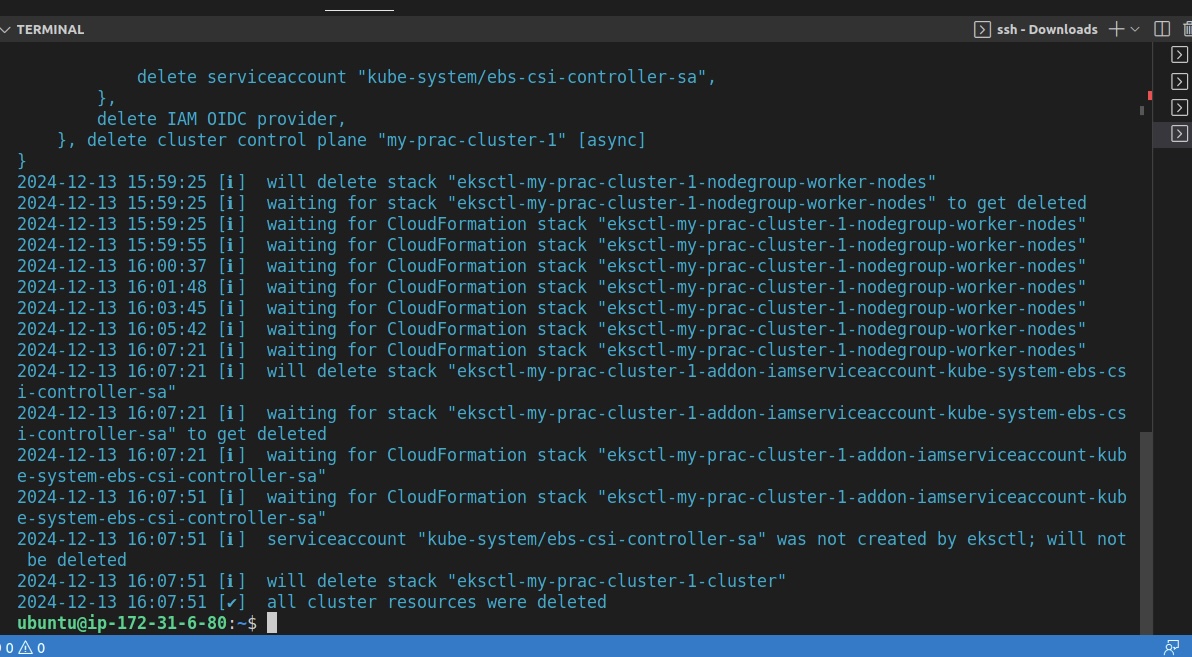
Now that everything is set up, we can delete our Kubernetes Cluster to avoid extra costs. Run the following commands to do so:
eksctl delete cluster my-prac-cluster-1 –region us-east-1
Conclusion
This article teaches the theory behind monitoring and observability and highlights the roles of Prometheus and Grafana in these processes.
We went through a hands-on deployment of Prometheus and Grafana on an EKS cluster and a web application to illustrate how they can be effectively monitored using Grafana.
By leveraging these tools, administrators can enjoy real-time visibility into their Kubernetes infrastructure, easily spot performance bottlenecks, and confidently make decisions that enhance application performance and reliability.

